Methodology
Adaptation to implied motion
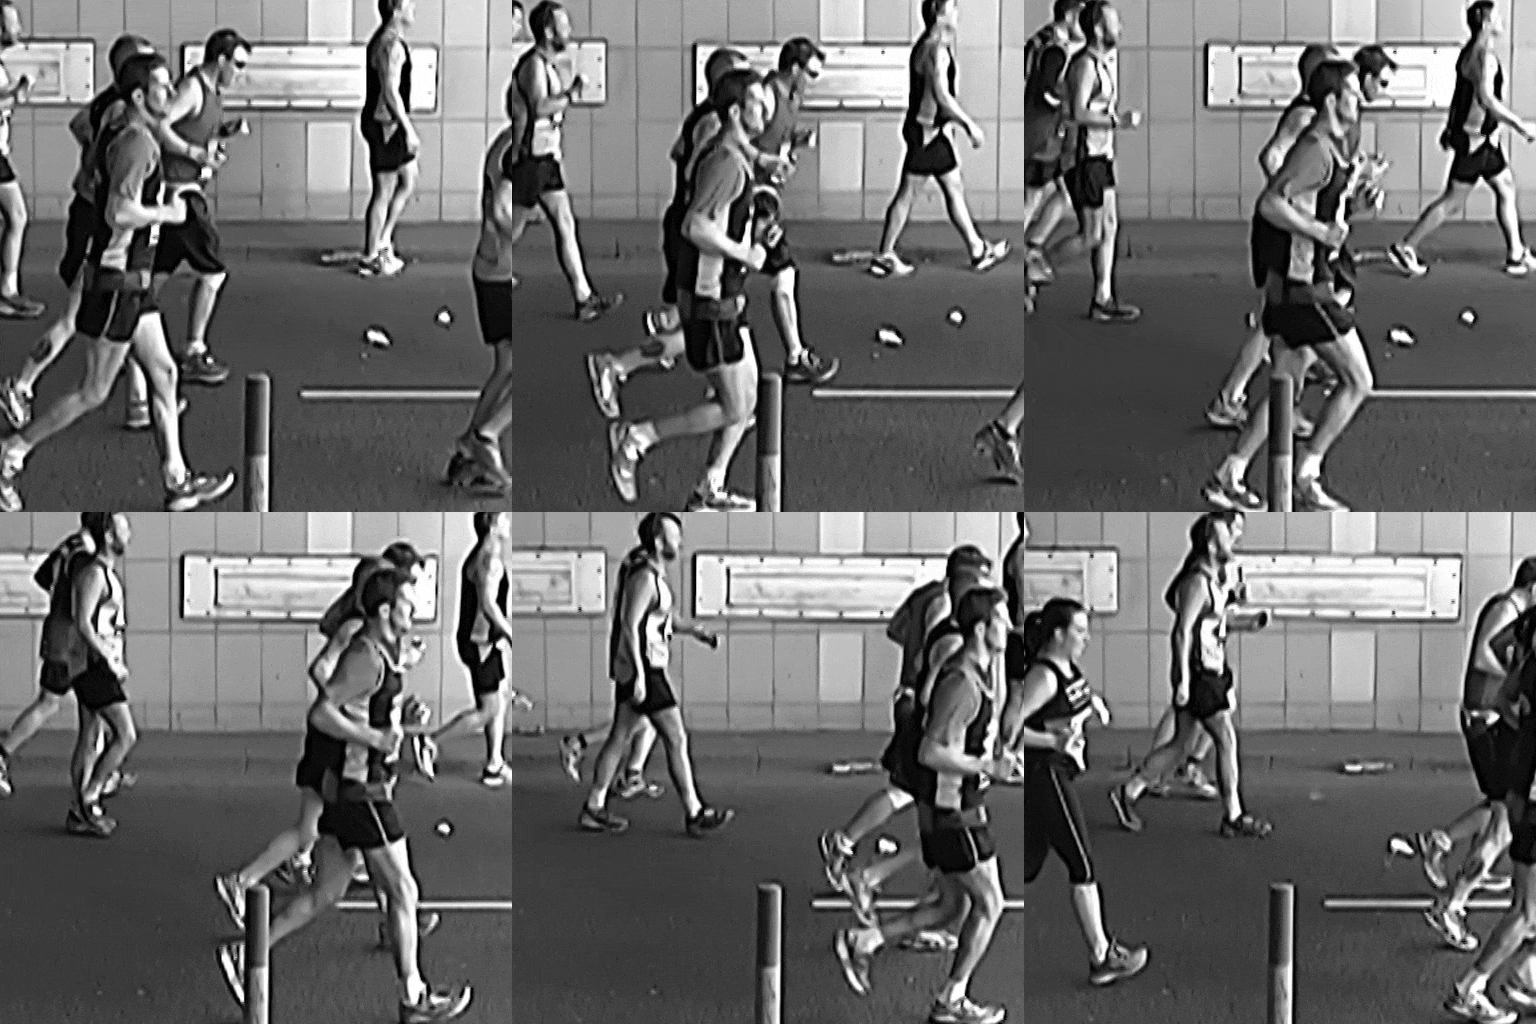
During the 60s adaptation period participants viewed a sequence of photographs (5 per second) each depicting runners in a sporting event. The images were random still-frames from a video made at the London Marathon in 2014, and in separate sessions the figures ran towards the right or towards the left. Following adaptation participants were shown a dynamic pattern containing randomly positioned dots which tended to drift either leftward or rightward (randomly selected from trial to trial). The pattern was visible for 250ms, after which participants reported whether the dots appeared to move leftward or rightward by pressing the left or right button on a response box. A top-up of the adapting stimulus then appeared for 4s before the next test trial. An imbalance between right and left responses to the test pattern which is contingent upon the direction of the adapting pattern would be evidence for adaptation to implied motion.
To test whether the nature of the decision made by the participant influenced the results, as would be expected for an adaptation effect caused by response or decision bias, we conducted two experiments which used identical stimuli and procedures, but two different tasks. The test stimulus contained coherently moving dots only in one half of the display, either top or bottom randomly selected from trial to trial. In one experiment, participants reported the direction (left versus right) of any motion they saw regardless of where in the display it was; in the other experiment, participants reported which half of the display (top versus bottom) contained coherent motion regardless of its direction.
Adaptation to human locomotion
Intact human forms
We used an adaptation technique to test whether judgements of human locomotion speed are affected by previous viewing of locomotion. Participants viewed an adapting video depicting locomotion for 30s, then a short (0.5s) inter-stimulus interval followed by a test video also containing locomotion (~0.5s). The Method of Single Stimuli (MSS) was used to assess perceived locomotion speed in the test video: Participants were asked to judge whether the locomotion in the test stimulus appeared faster or slower than a natural pace, with natural pace referring to the speed at which humans move in real life. Once they had given a response (pressing the left or right button on a response box), the next trial started with a top-up of adaptation (5s). Participants sat three sessions of 140 trials each.
The stimuli used were videos either of runners in the London marathon (as used in the implied motion experiments) or of people walking along Lincoln high street. Playback speed was altered by skipping frames and/or altering the duration of each frame. The adapting stimuli were presented at one of three speeds:
Slow (0.48x speed)
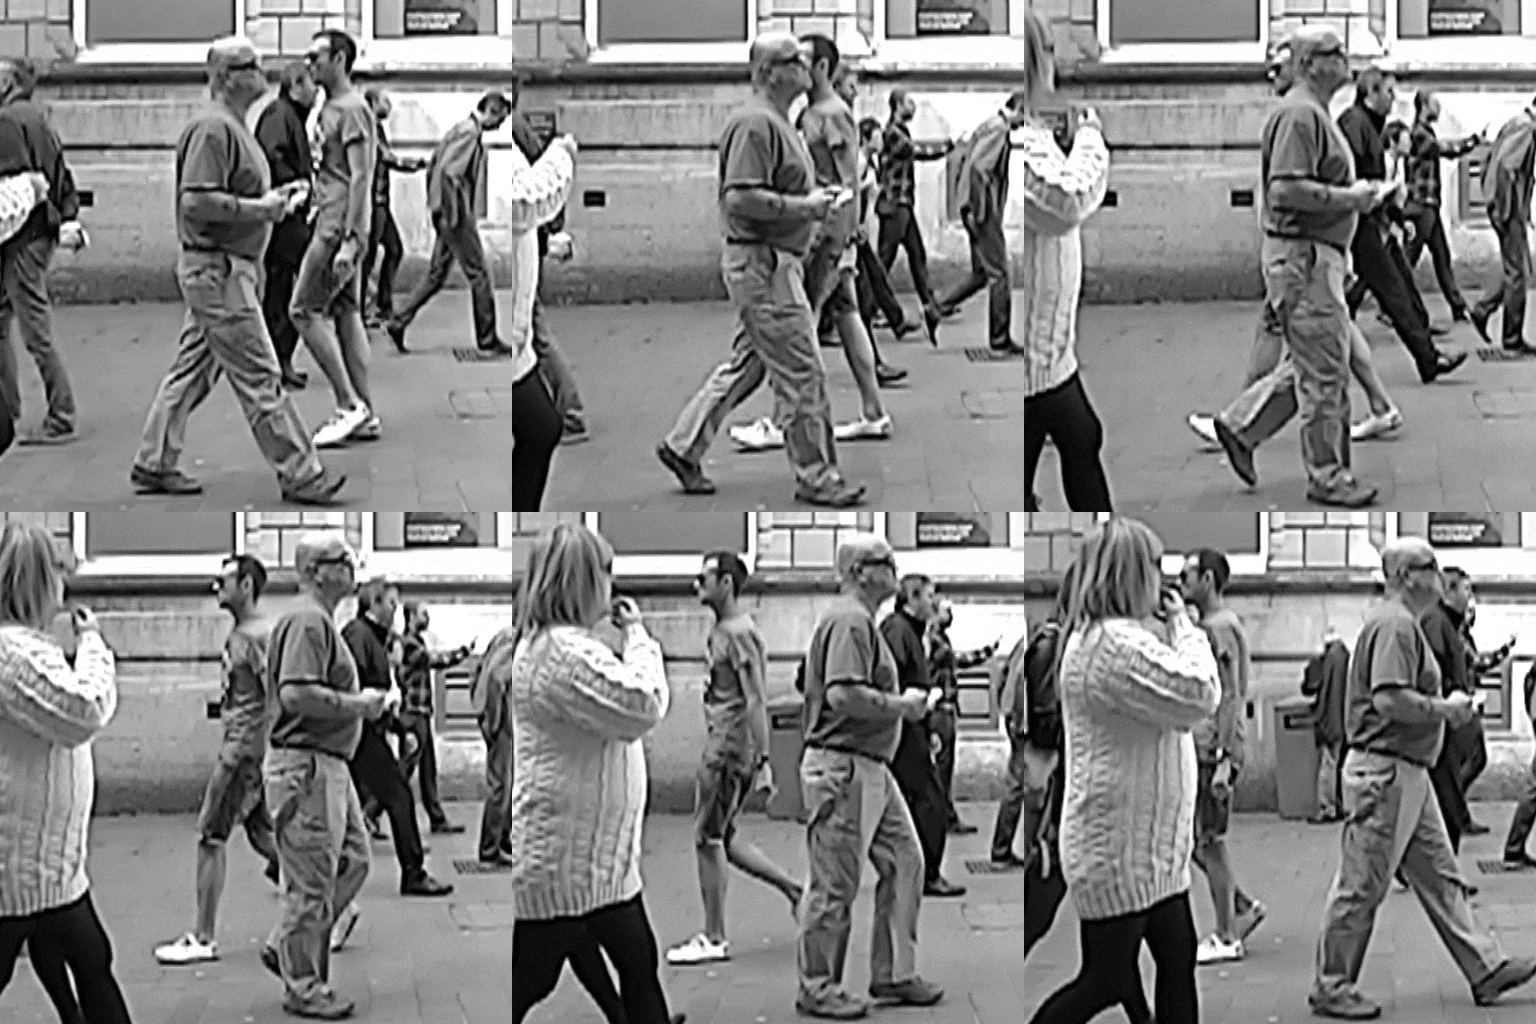
Normal (0.96x speed)
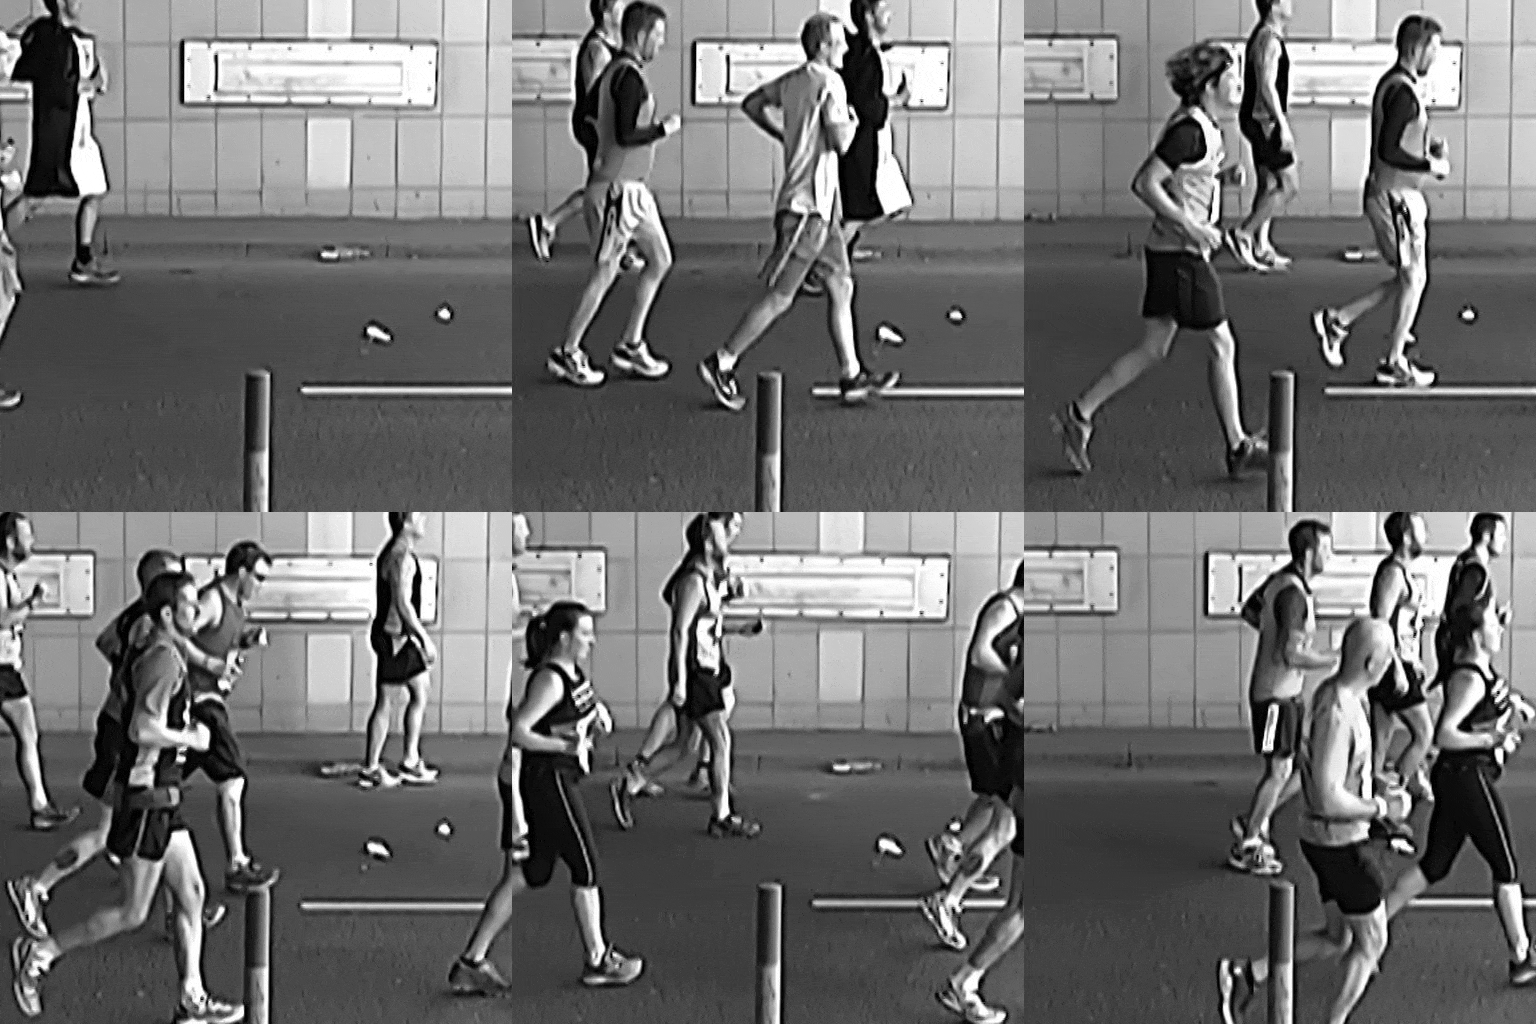
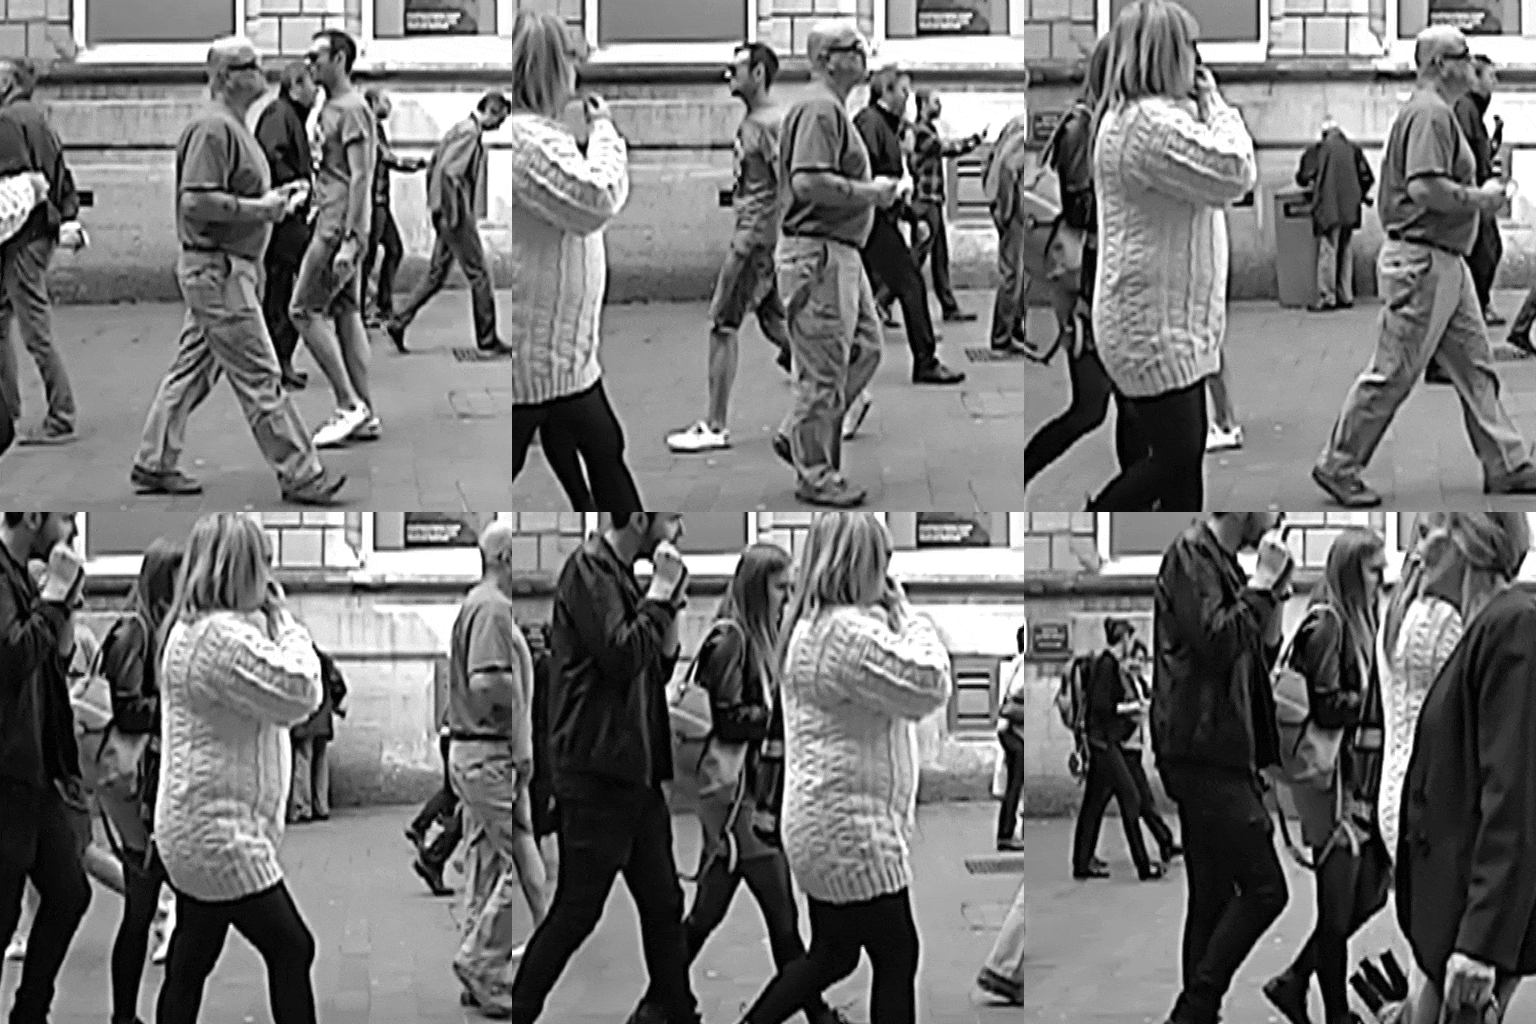
Fast (1.44x speed)
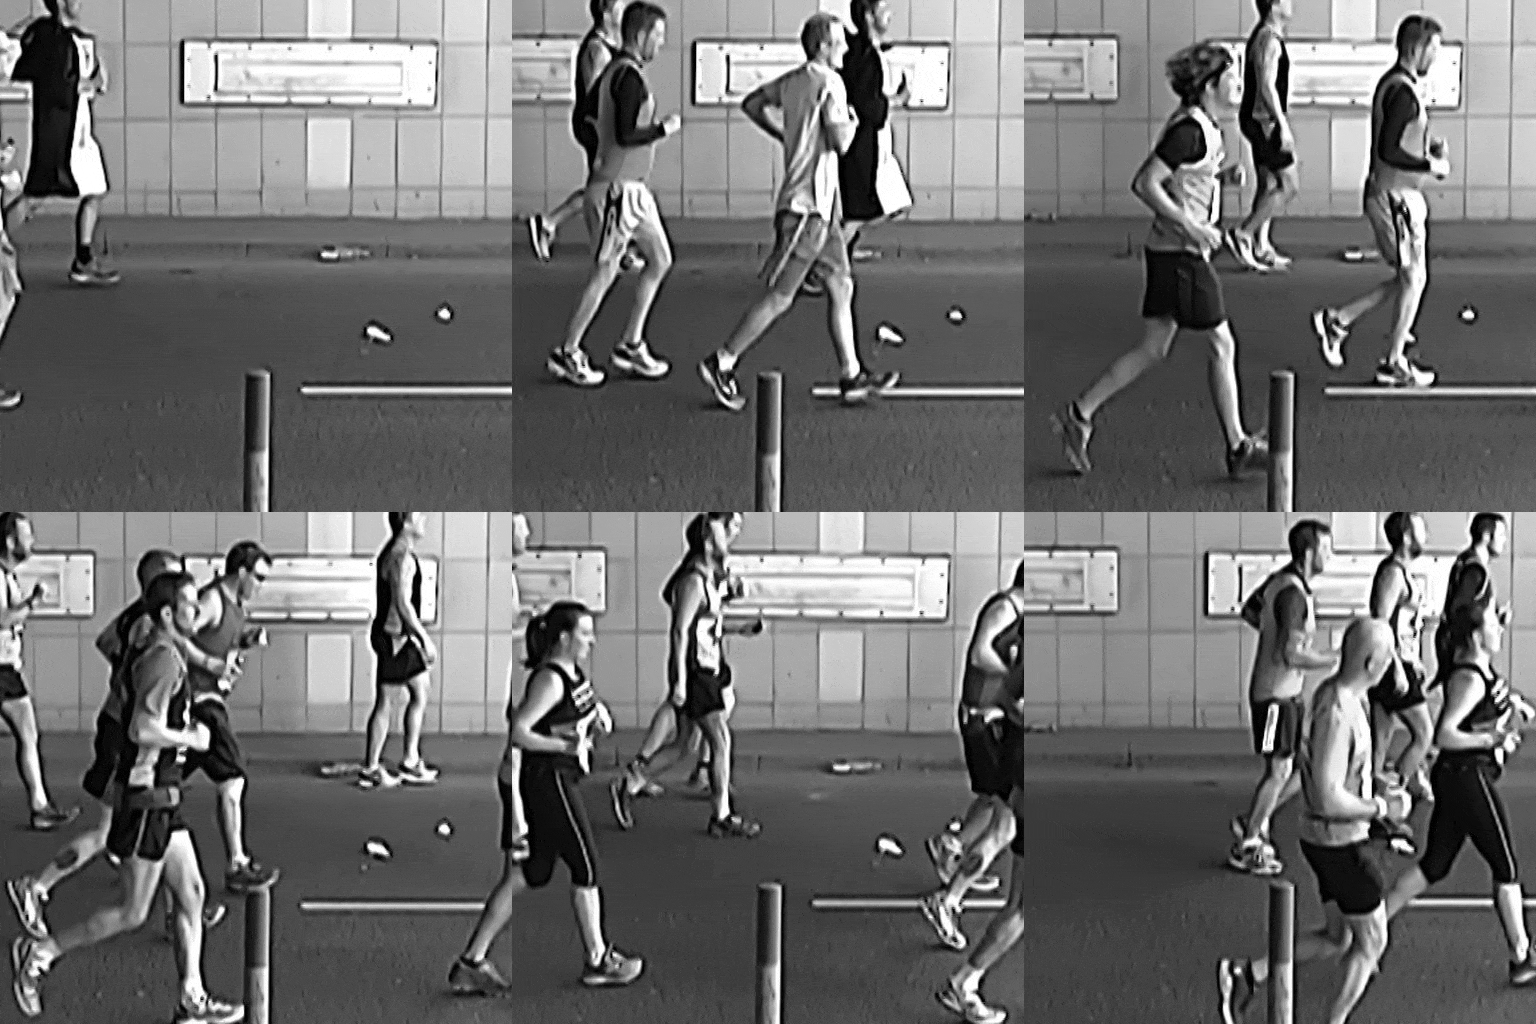
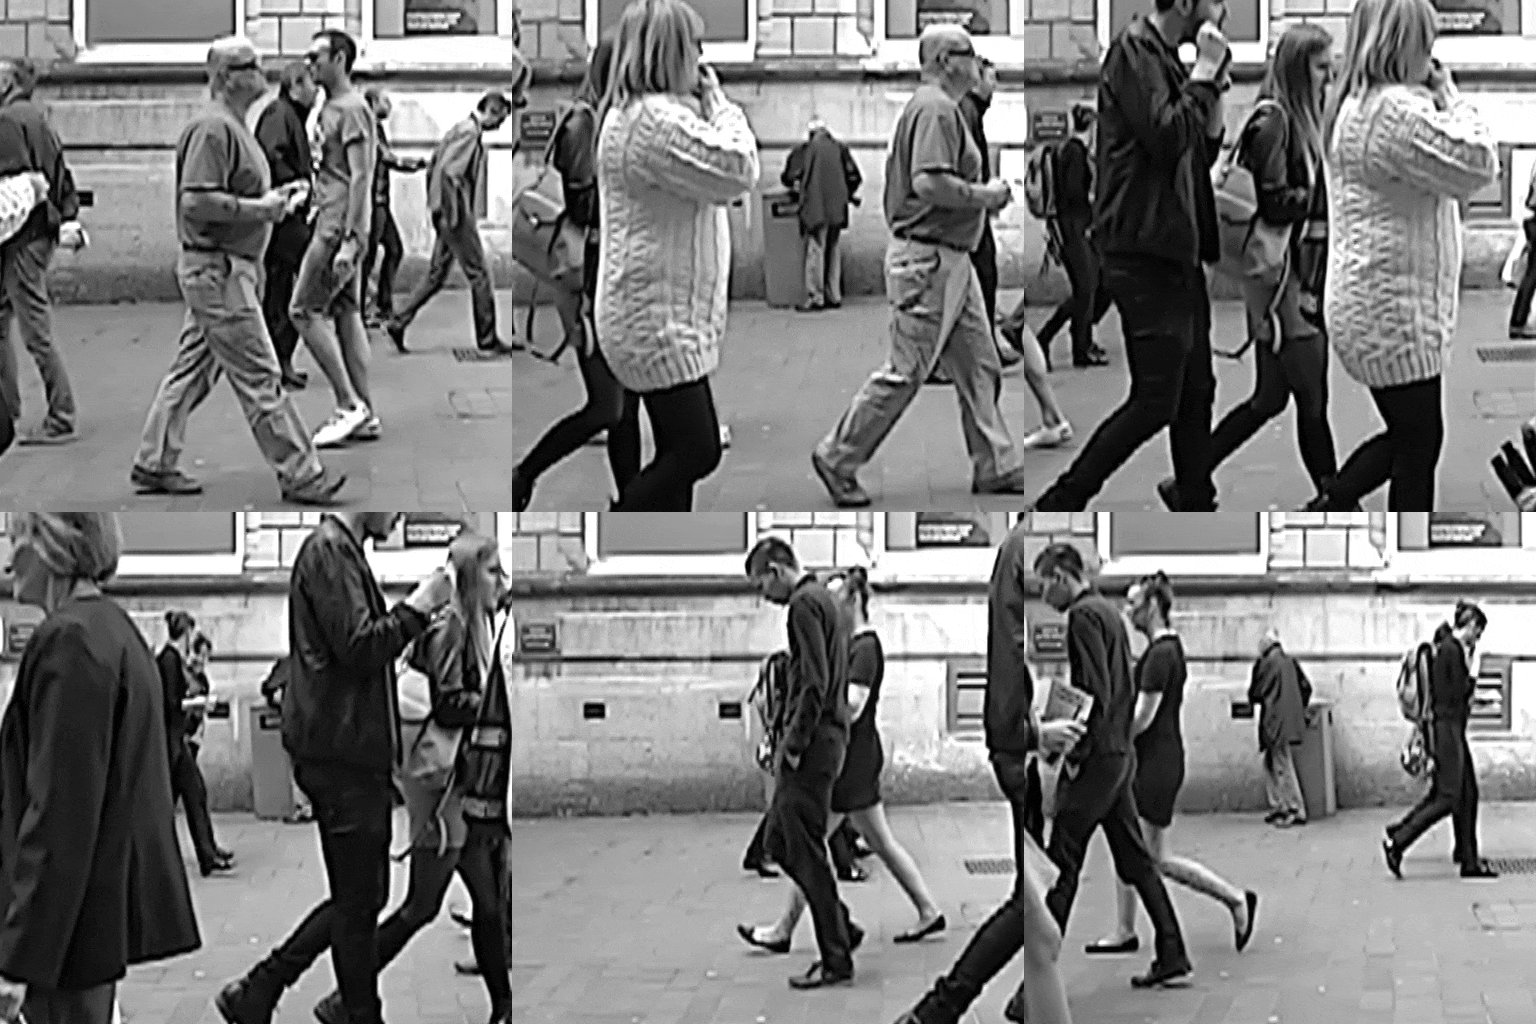
During the experiment the speed of each test stimulus was chosen at random from the following seven possible values (determined by pilot experiments):
| Adapt Condition | Speed | ||||||
| Slow | 0.48x | 0.58x | 0.64x | 0.72x | 0.8x | 0.96x | 1.12x |
| Normal | 0.64x | 0.72x | 0.8x | 0.96x | 1.12x | 1.2x | 1.28x |
| Fast | 0.8x | 0.96x | 1.12x | 1.2x | 1.28x | 1.34x | 1.44x |
Each test speed was presented 20 times. Response rates to different test playback speeds generated a psychometric function for each adapting condition, representing the proportion of ‘fast’ responses as a function of test speed. We fitted a cumulative normal curve to the function to estimate the test playback speed which appeared ‘natural’, which corresponded to the midpoint or mean of the normal curve.
Scrambled human forms
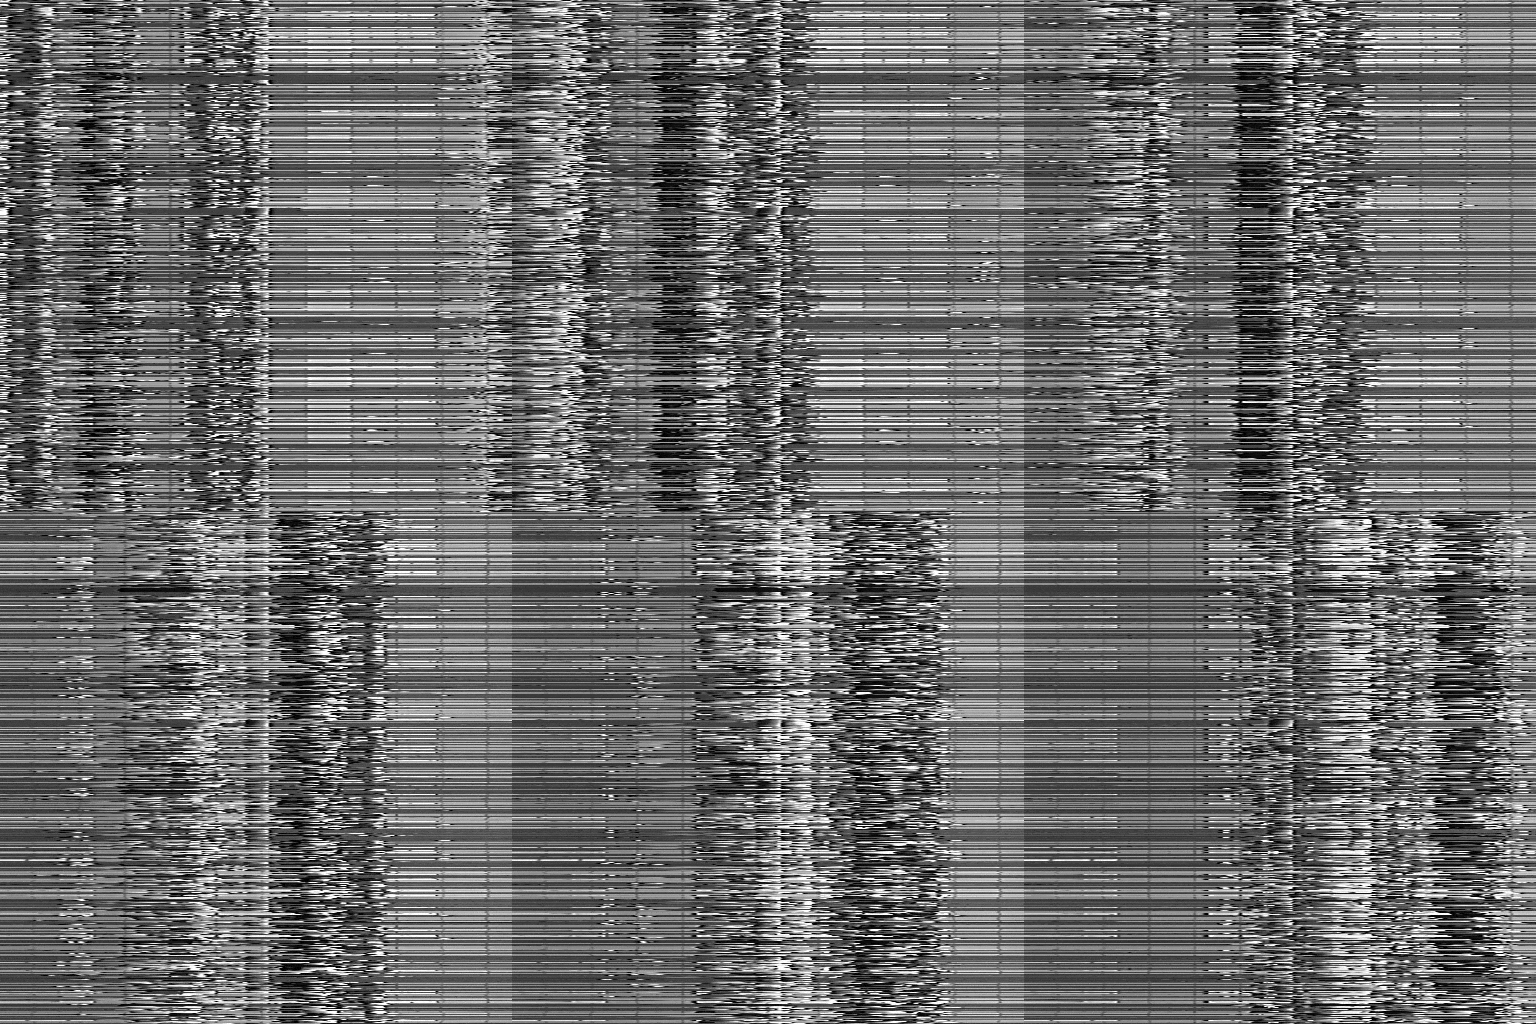
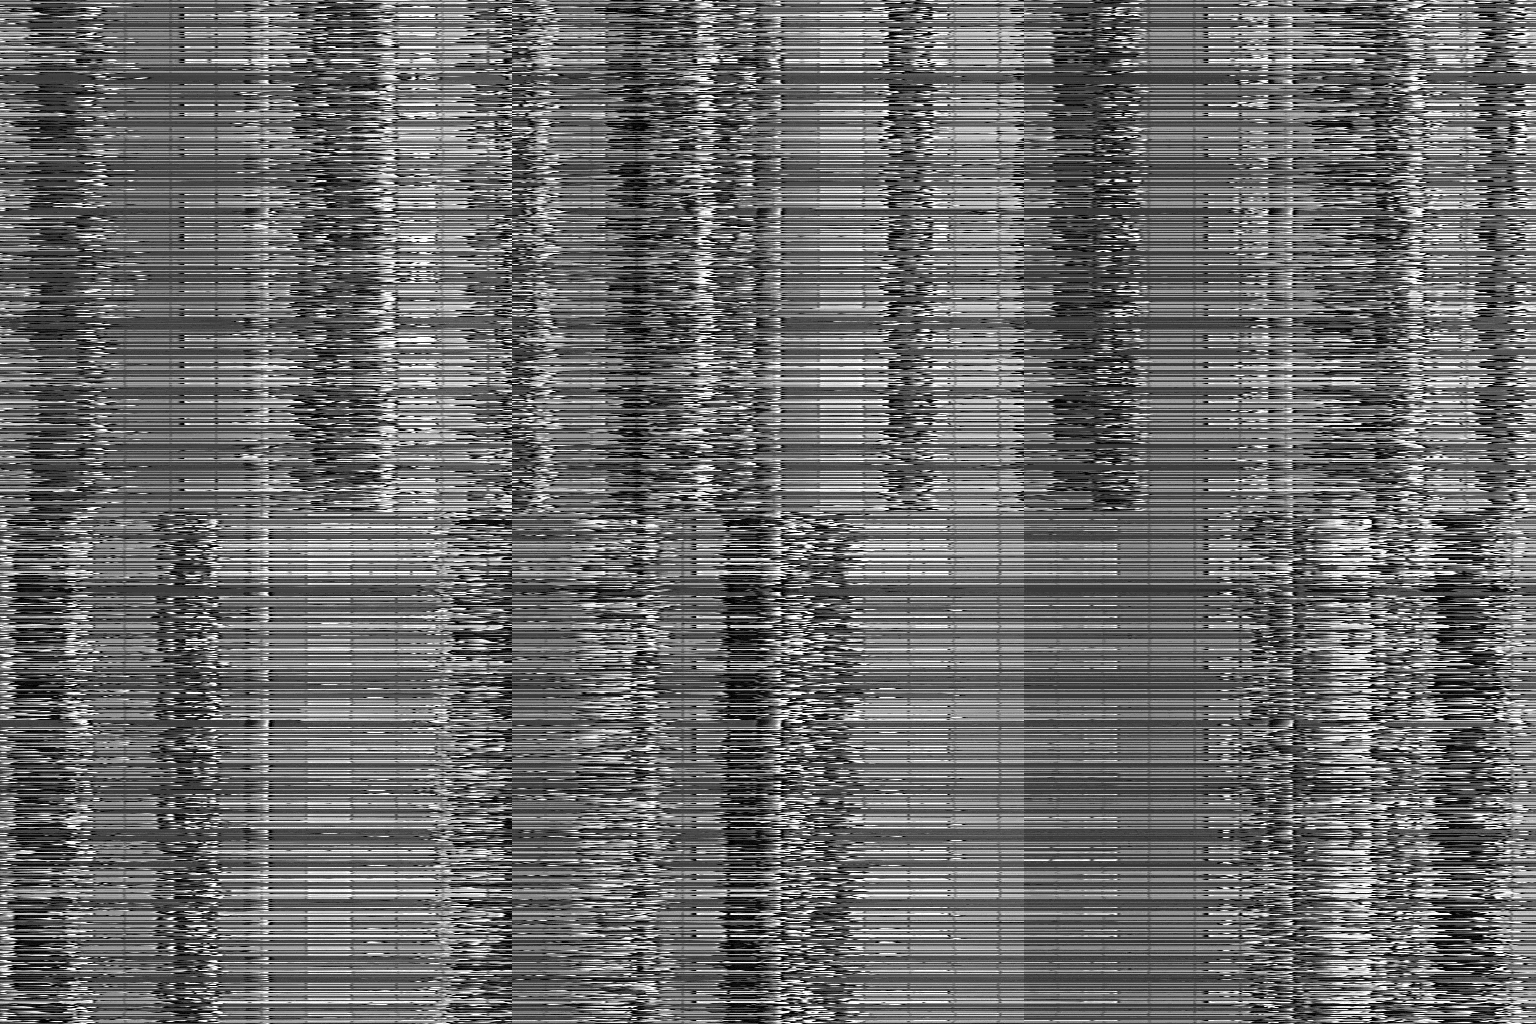
In order to assess whether visible human forms were necessary to obtain an adaptation effect, we used the same experimental protocol, but with a version of the adapting video which had been spatially scrambled by randomly shuffling rows of pixels. The demos below show videos with horizontal rows of pixels scrambled. This scrambling process destroys meaningful content but preserves low-level motion, flicker, and spatial frequency information.
| Slow | Normal | Fast |
 |
 |
 |
In one experiment, participants were presented with scrambled adapting stimuli and then asked to make judgements about an intact (non-scrambled) test stimulus, to test for an effect on apparent locomotion speed. In another, both the adapt and test stimuli were scrambled to test for conventional velocity after-effects.
We also used stimuli which had been scrambled vertically by randomly shuffling columns, which discards information about velocity but preserves temporal frequency content. The stimuli used in this experiment are shown below:
| Slow | Normal | Fast |
 |
 |
 |
Adaptation to point-light walkers
To investigate the role of low-level versus high-level processing in adaptation to locomotion, we used stimuli which depicted walking human figures solely in terms of moving points of light located at the major joints, known as point-light walkers (PLW), as shown below:
These walkers were generated using a Matlab function based on Cutting’s (1978) algorithm, which calculates the position of each point in each frame based on user-defined parameters. A copy of the Matlab script is available on request. The torso height of each of the four walkers depicted in the experimental stimulus varied randomly, as did their walking direction, in order to randomise low-level information about size, speed and direction, but all four walkers walked at the same locomotion speed in each display. This speed, relative to natural speed, was controlled by altering the number of frames per “loop” of the animation, which corresponded to a single step cycle of locomotion: With the display frame-rate fixed at 120Hz, increasing the number of frames in one step cycle of the animation slows down locomotion speed, and vice versa. The 120Hz frame-rate and synthetic walker algorithm gave us much finer control over locomotion speed than was possible with the video-based stimuli. According to Cutting (1978), at our presentation rate the number of frames per step cycle required to generate a natural speed walker was 160, but we tested this in a control experiment and found that natural speed corresponded to 152 frames.
References
Cutting, J. E. (1978). A program to generate synthetic walkers as dynamic point-light displays. Behavior Research Methods & Instrumentation, 10(1), 91-94.
2AFC
The MSS is prone to response or decision bias because participants could bias their responses towards ‘fast’ or ‘slow’ when uncertain, so producing a small shift in the psychometric function and measured P50 value. Morgan et al. (2013) described a two-alternative forced choice (2AFC) task which avoids this possibility.
As in the MSS experiments, participants were presented first with an adapting stimulus at one of three speeds, however rather than making a judgement as to the speed of a single subsequently presented test stimulus (MSS), they were shown two stimuli which differed in speed, and asked to select one (2AFC); the stimulus in which the locomotion appeared to be closer to natural locomotion. Stimulus values were selected so that in some trials both stimuli were slower than natural pace (but one was closer than the other), or both were faster, or one was faster and the other was slower. So the participant could not bias the result by selecting the slower (or faster), or first (or second) stimulus consistently when they were uncertain.
We used the 2AFC task in experiments involving the running videos and the PLW stimuli.
References
Morgan, M. J., Melmoth, D., Solomon, J. A. (2013) Visual Neuroscience, 30, 197–206. doi:10.1017/S095252381300045X


